What is Higher High, Higher Low, Lower Low, Lower High in Price Action Trading
- VasilyTrader
- Apr 18, 2023
- 2 min read
Updated: Jan 25

In this educational article, we will discuss the foundation of price action analysis: the concepts of highs and lows.
In order to grasp that concept, you should learn to perceive the price chart as the sequence of zigzags.
Depending on the direction of the market and the shape of these zigzags, its peaks will be called differently. There are 6 types of them that you should learn to recognize.
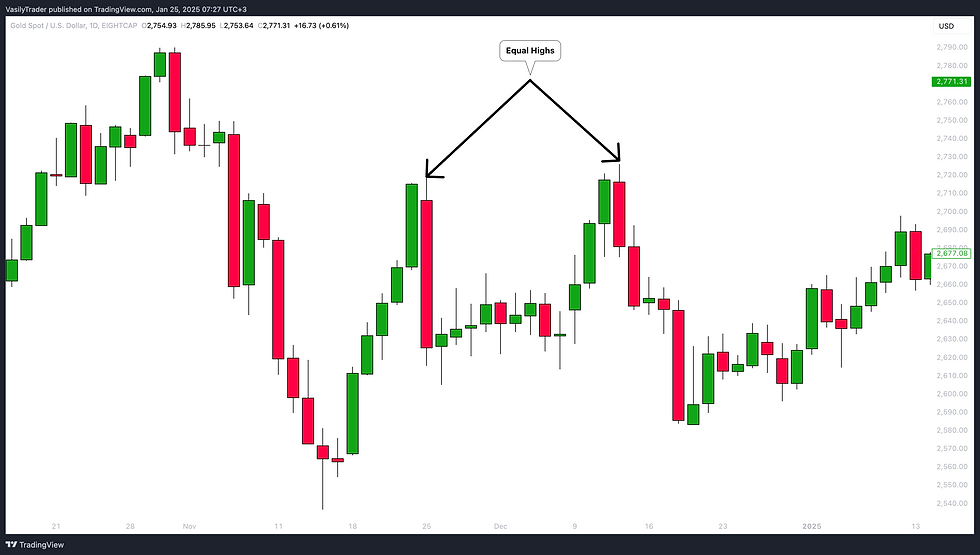
1️⃣ Equal Highs (EH).
The peaks of bullish moves will be called equal highs, if they perfectly respect the same level (resistance), retracing from that and not managing to break above.

Above is the example of equal highs on Gold chart on a daily.
2️⃣ Equal Lows (EL).
The peaks of bearish moves will be called equal lows, if they perfectly respect the same level (support), bouncing from that and not managing to break below.

Find perfect equal lows on USDCAD on the chart above.
3️⃣ Higher High (HH).
The peak of a bullish move will be called Higher High, if the price manages to violate the previous high after a retracement.

Look at a perfect sequence of higher highs on NZDUSD.
4️⃣ Lower Low (LL).
The peak of a bearish move will be called Lower Low, if the price manages to violate the previous low after a pullback.

Trading in a strong bearish trend, NZDCAD keeps updating lower lows on a daily.
5️⃣ Higher Low (HL).
The peak of a bearish move will be called Higher Low if, after a retracement from the high, the price manages to set a low that is higher than the previous low.

Back to the example on NZDUSD. Not only the price updates the higher highs but also the higher lows.
6️⃣ Lower High (LH).
The peak of a bullish movement will be called Lower High if, after a pullback from the low, the price sets a high that is lower than the previous high.

That's how EURJPY acted on a daily, setting 2 nice lower highs.
Why these terms are so important?
Because, firstly, you can apply them to objectively identify the market trend.
Secondly, all the price action patterns are based on a combination of these highs and lows.
You should learn these terms by heart, and you should learn to perceive the price chart as the sequence of zigzags, with a strict designation of each peak.

