
Learn 3 Best Time Frames for Day Trading Forex
- VasilyTrader
- Feb 25
- 3 min read

If you want to day-trade Forex, but you don't know what time frames you should use for chart analysis and trade execution, don't worry.
In this article, I prepared for you the list of best time frames for intraday trading and proven combinations for multiple time frame analysis.
For day trading forex with multiple time frame analysis, I recommend using these 3 time frames: daily, 1 hour, 30 minutes.
Daily Time Frame Analysis
The main time frame for day trading Forex is the daily.
It will be applied for the identification of significant support and resistance levels and the market trend.
You should find at least 2 supports that are below and 2 resistances above current prices.
Uptrend
In a bullish trend, supports will be applied for trend-following trading, the resistances - for trading against the trend.

That's the example of a proper daily time frame analysis on GBPCHF for day trading.
The pair is in an uptrend and 4 significant historic structures are underlined.
Downtrend
In a bearish, a short from resistance will be a daytrade WITH while a long from support will be against the trend.

Look at GBPAUD. The market is bearish, and a structure analysis is executed.
Purpose
Identified supports and resistances will provide the zones to trade from. You should let the price reach one of these areas and start analyzing lower time frames only then.
Remember that counter trend trading setups always have lower accuracy and a profit potential.
Your ability to properly recognize the market direction and the point that you are planning to open a position from will help you to correctly assess the winning chances and risks.

1H/30M Time Frames Analysis
These 2 time frames will be used for confirmations and entries.
What exactly should you look for?
It strictly depends on the rules of your strategy and trading style.
To Sell
After a test of a resistance, one should wait for a clear sign of strength of the sellers: it can be based on technical indicators, candlestick, chart pattern, or something else.
For my day trading strategy, I prefer a price action based confirmation.
I wait for a formation of a bearish price action pattern on a resistance.

Look at GBPJPY on a daily. Being in an uptrend, the price is approaching a key resistance. From that, one can look for a day trade.

In that case, a price action signal is a double top pattern on 1H t.f and a violation of its neckline. That provides a nice confirmation to open a counter trend short trade.

Look at a retracement that followed then.
In this situation, there was no need to open 30 minutes chart because a signal was spotted on 1H.
I will show you when one should apply this time frame in another setup.
To Buy
Once the price is on a key daily support, start looking for a bullish signal.
For me, it will be a bullish price action pattern.

USDCAD is in a strong bullish trend. The price tests a key support.
It can be a nice area for a day trade.

Opening an hourly chart, we can see no bullish pattern.
If so, open even lower time frame, quite often it will reveal hidden confirmations.

A bullish formation appeared on 30 minutes chart - a cup & handle.
Violation of its neckline is a strong day trading long signal.
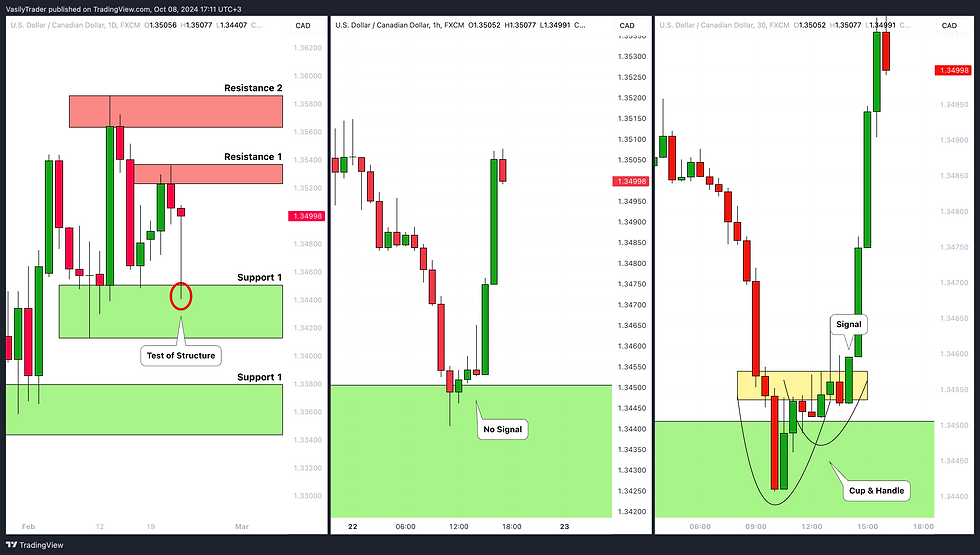
Look how rapidly the price started to grow then.
In order to profitably day trade Forex, a single time frame analysis is not enough.
Incorporation of 3 time frames: daily and two intraday will help you to identify trading opportunities from safe places with the maximum reward potential.
