
Best Technical Indicator to Identify Order Block & Imbalance (Smart Money Concept SMC Trading)
- Vasily Trader

- Mar 4
- 2 min read

Your ability to correctly identify Imbalances and Order Blocks on a price chart is essential for profitable trading Smart Money Concept.
In this article, I will show you the best technical indicator that will help you to spot Order Block & Imbalance on any financial market.
Order Block Definition
First, in brief, let me give you my definition of Order Block.
The problem is that in SMC trading there is no one single definition of that and many traders interpret it differently.
To me, an Order Block is a specific zone on a chart from where a strong price movement initiates and where a significant imbalance between supply and demand occurs.
This imbalance should strictly originate from a liquidity zone.
That definition implies that in order to identify an Order Block zone, one should learn to properly identify the imbalance and liquidity zones.
And again, there is no precise definition of an imbalance on a price chart.
To me, a bullish imbalance is a formation of a bullish engulfing candle - the one that engulfs a range of previous bearish candle with its body.

Above is the example of a valid Order Block on GBPUSD.
A bearish imbalance is a formation of a bearish engulfing candle - the one that engulfs a range of a previous bullish candle with its body.

Above, you can see the example of an Order Block on USDCAD, based on a bearish imbalance.
Order Block Technical Indicator
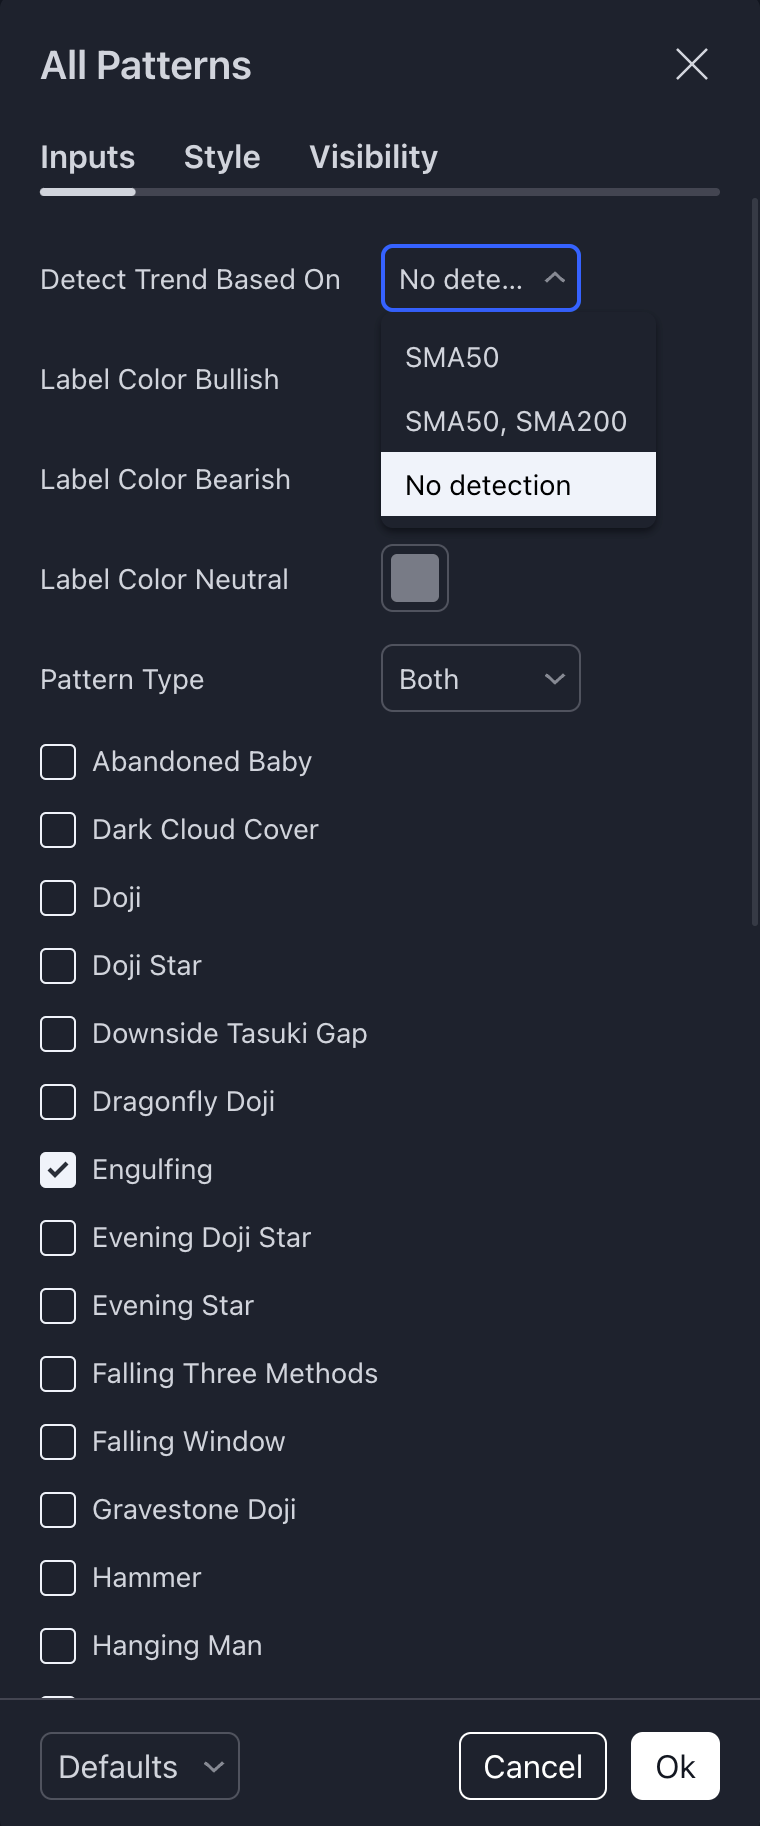
There is one technical indicator that will help you to recognize such Order Blocks. It is called "All Candlestick Patterns" on TradingView.

Open settings of the indicator and make it show ONLY Engulfing Candles and choose "No Detection" in "Detect Trends Based on".
How to Use It?
After that, hide the indicator and first.
Identify the liquidity zones on a chart and wait for a test of one of these zones.
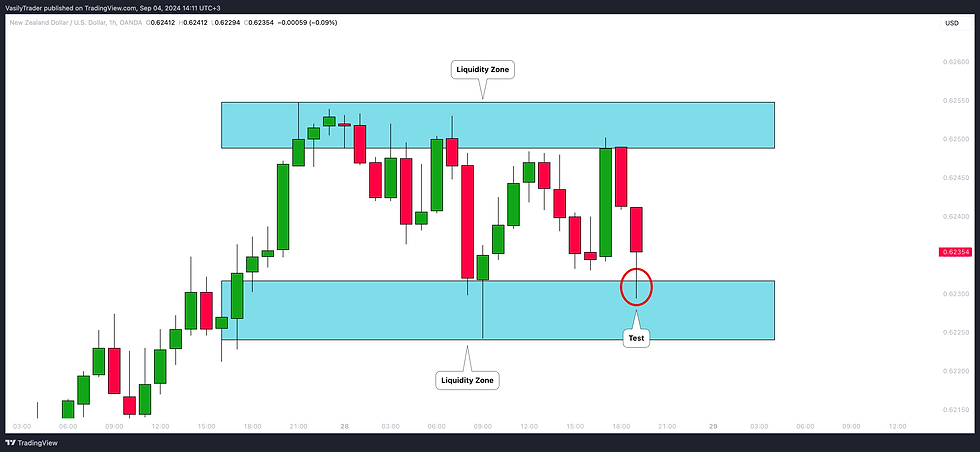
Here is a test of a liquidity zone on NZDUSD on an hourly time frame.
After that, turn on the indicator, and wait for its signal.

You can see that after some time, the price formed a bullish imbalance with a bullish engulfing candle. The indicator highlight that candle.

Bullish Order Block zone will be based on the lowest low of 2 candles and the high of a bearish candle preceding the imbalance.

One more example. We see a test of a significant liquidity zone on EURAUD on a 4H time frame.

We turn on the indicator and look for a signal.
A bearish imbalance is formed, and the indicator immediately notifies us.

A bearish Order Block Zone in that case will be the area based on the highest high of 2 candles and the low of a bullish candle preceding the imbalance.
Of course, there will be the rare cases when the indicator will miss the imbalances. But while you are learning to recognize Order Blocks, this indicator will definitely help you a lot!


